
4.5 Pitch Adherence
Presented below are the audio clips and pitch contour plots of the four samples present in figure 4. We highlight instances of low and high correlation between ground truth and extracted pitch contours. In the paper we use correlation as a measure for ‘pitch adherence’ in the Spectrogram Generator and based on the audio samples.
The lower correlation samples (example 1 and 2) have a lower value due to either pitch detection errors or artifacts in the samples as seen below.
Example 1: Correlation (0.11)
Ground Truth Audio
Generated Audio
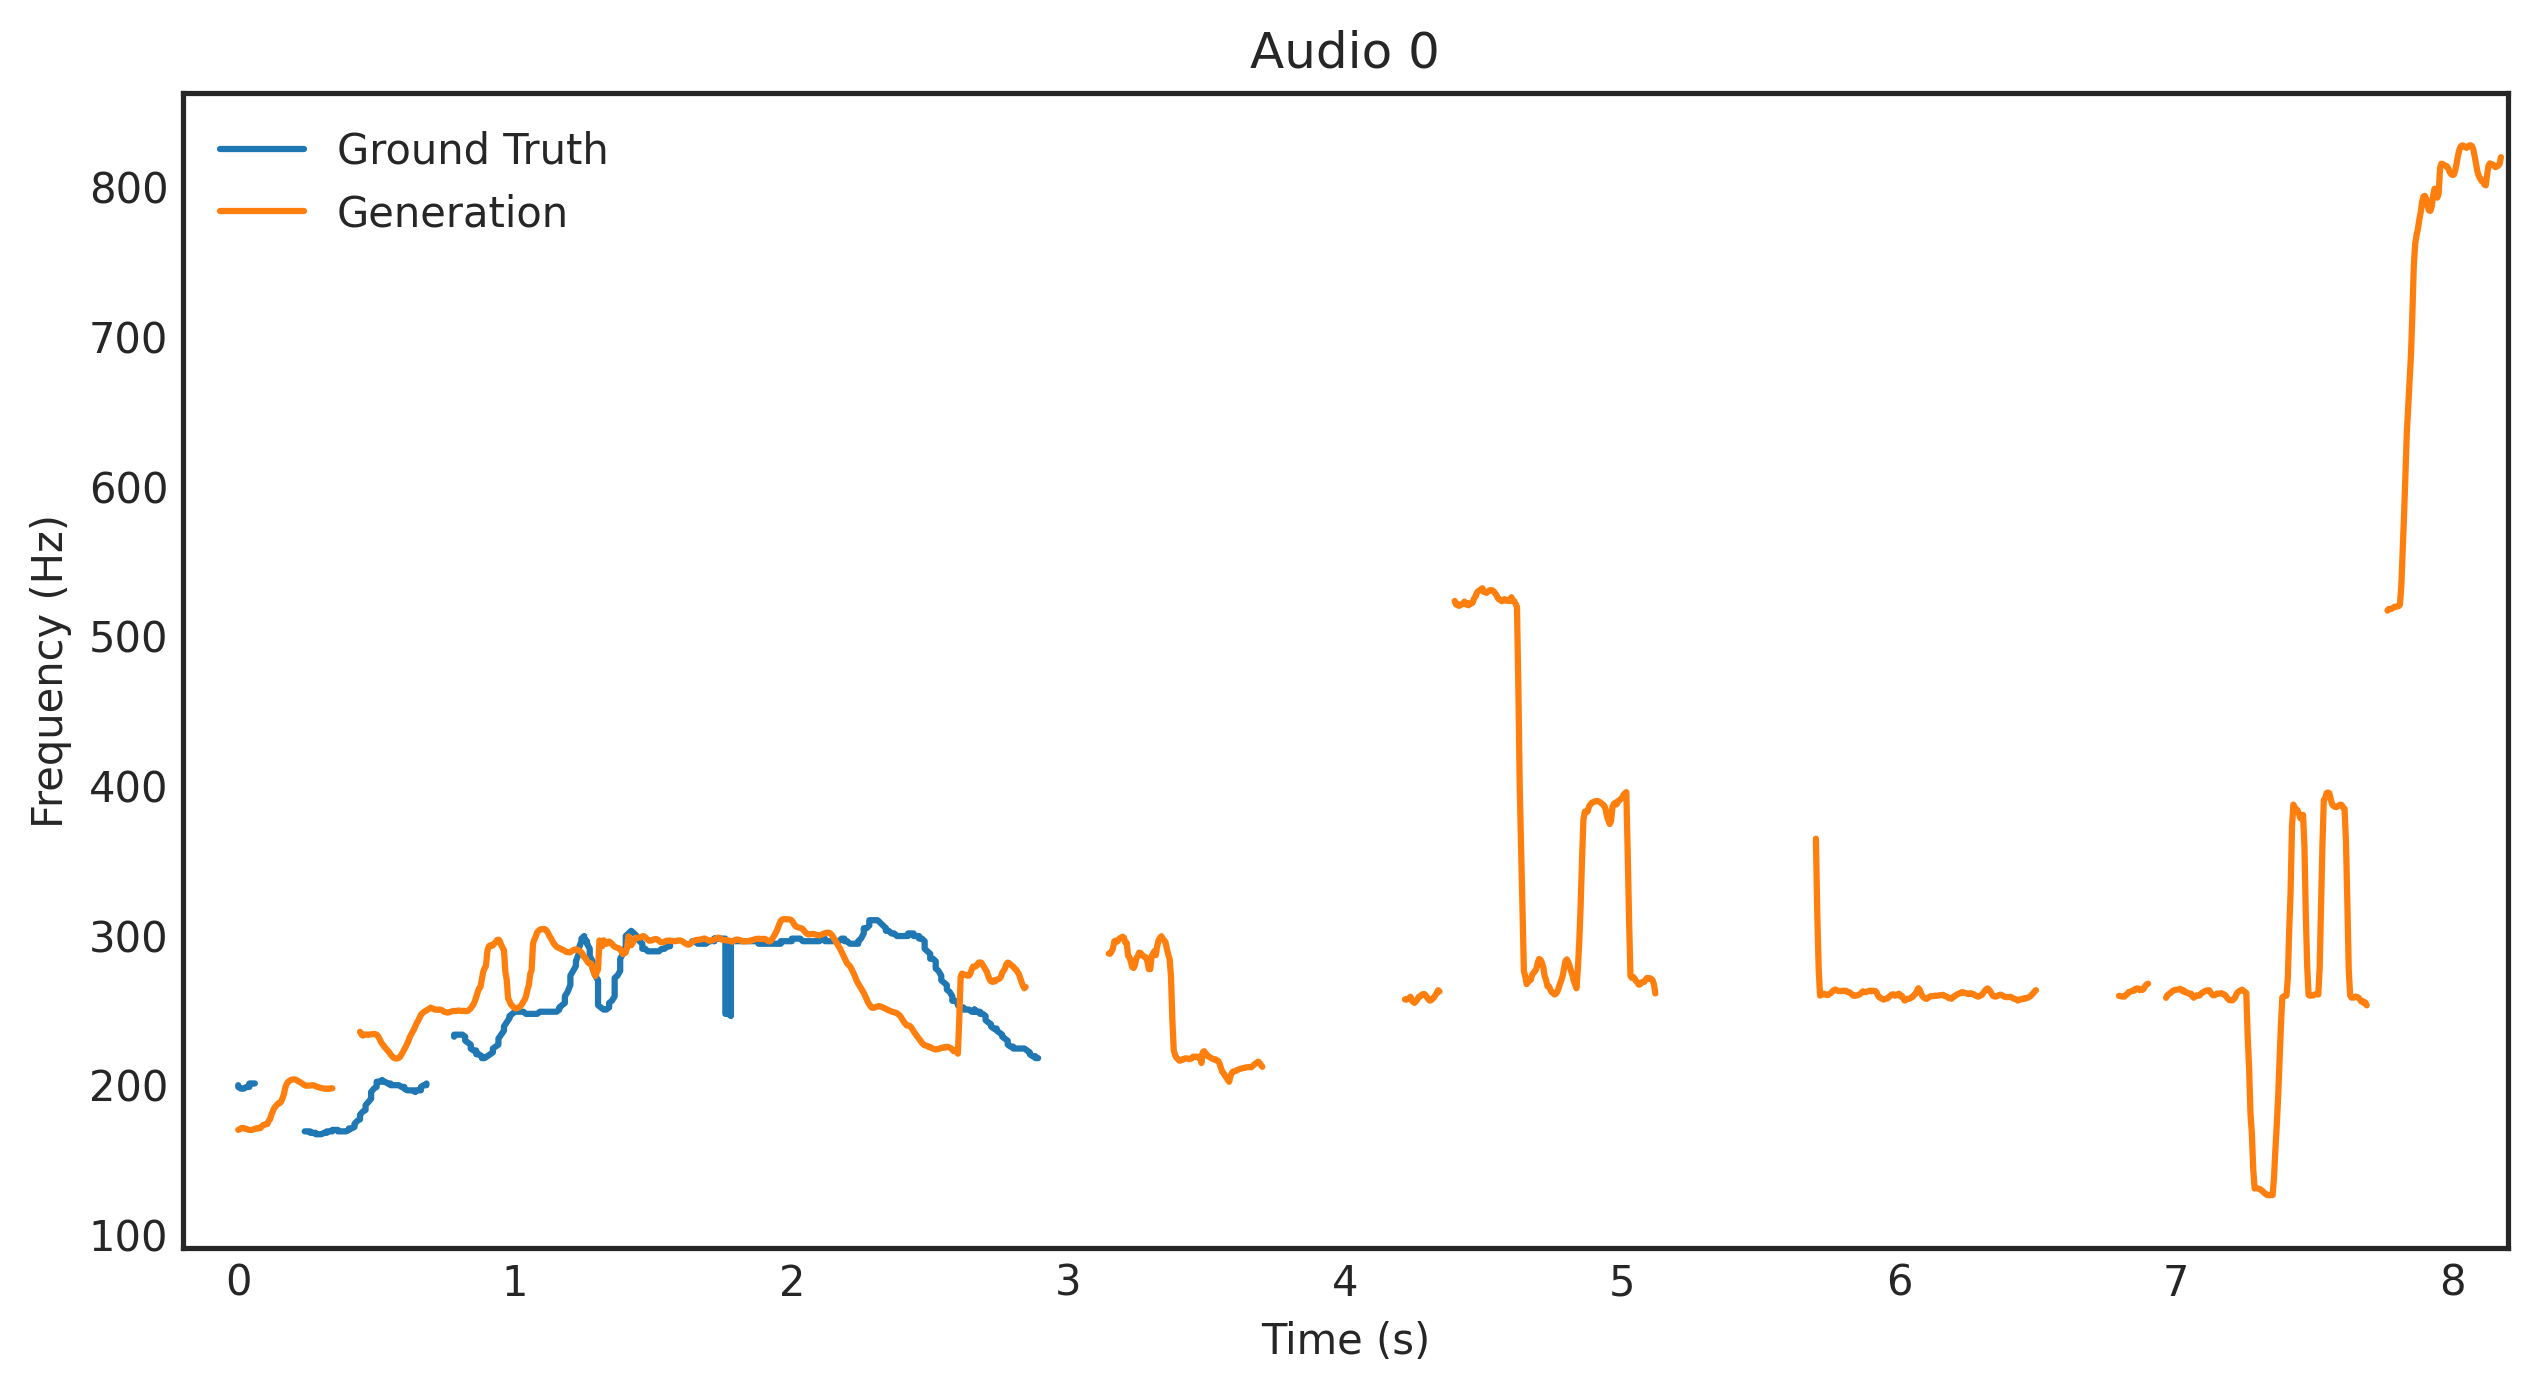
Plot of ground truth pitch contour condition and pitch extracted from audio generated by the spectrogram generator.
Example 2: Correlation (0.11)
Note: the plot of the generated pitch contour of Audio 1 in Fig 4 of the paper is incorrect. Although the correlation remains the same value (0.1), the corrected plot is presented below.
Ground Truth Audio
Generated Audio
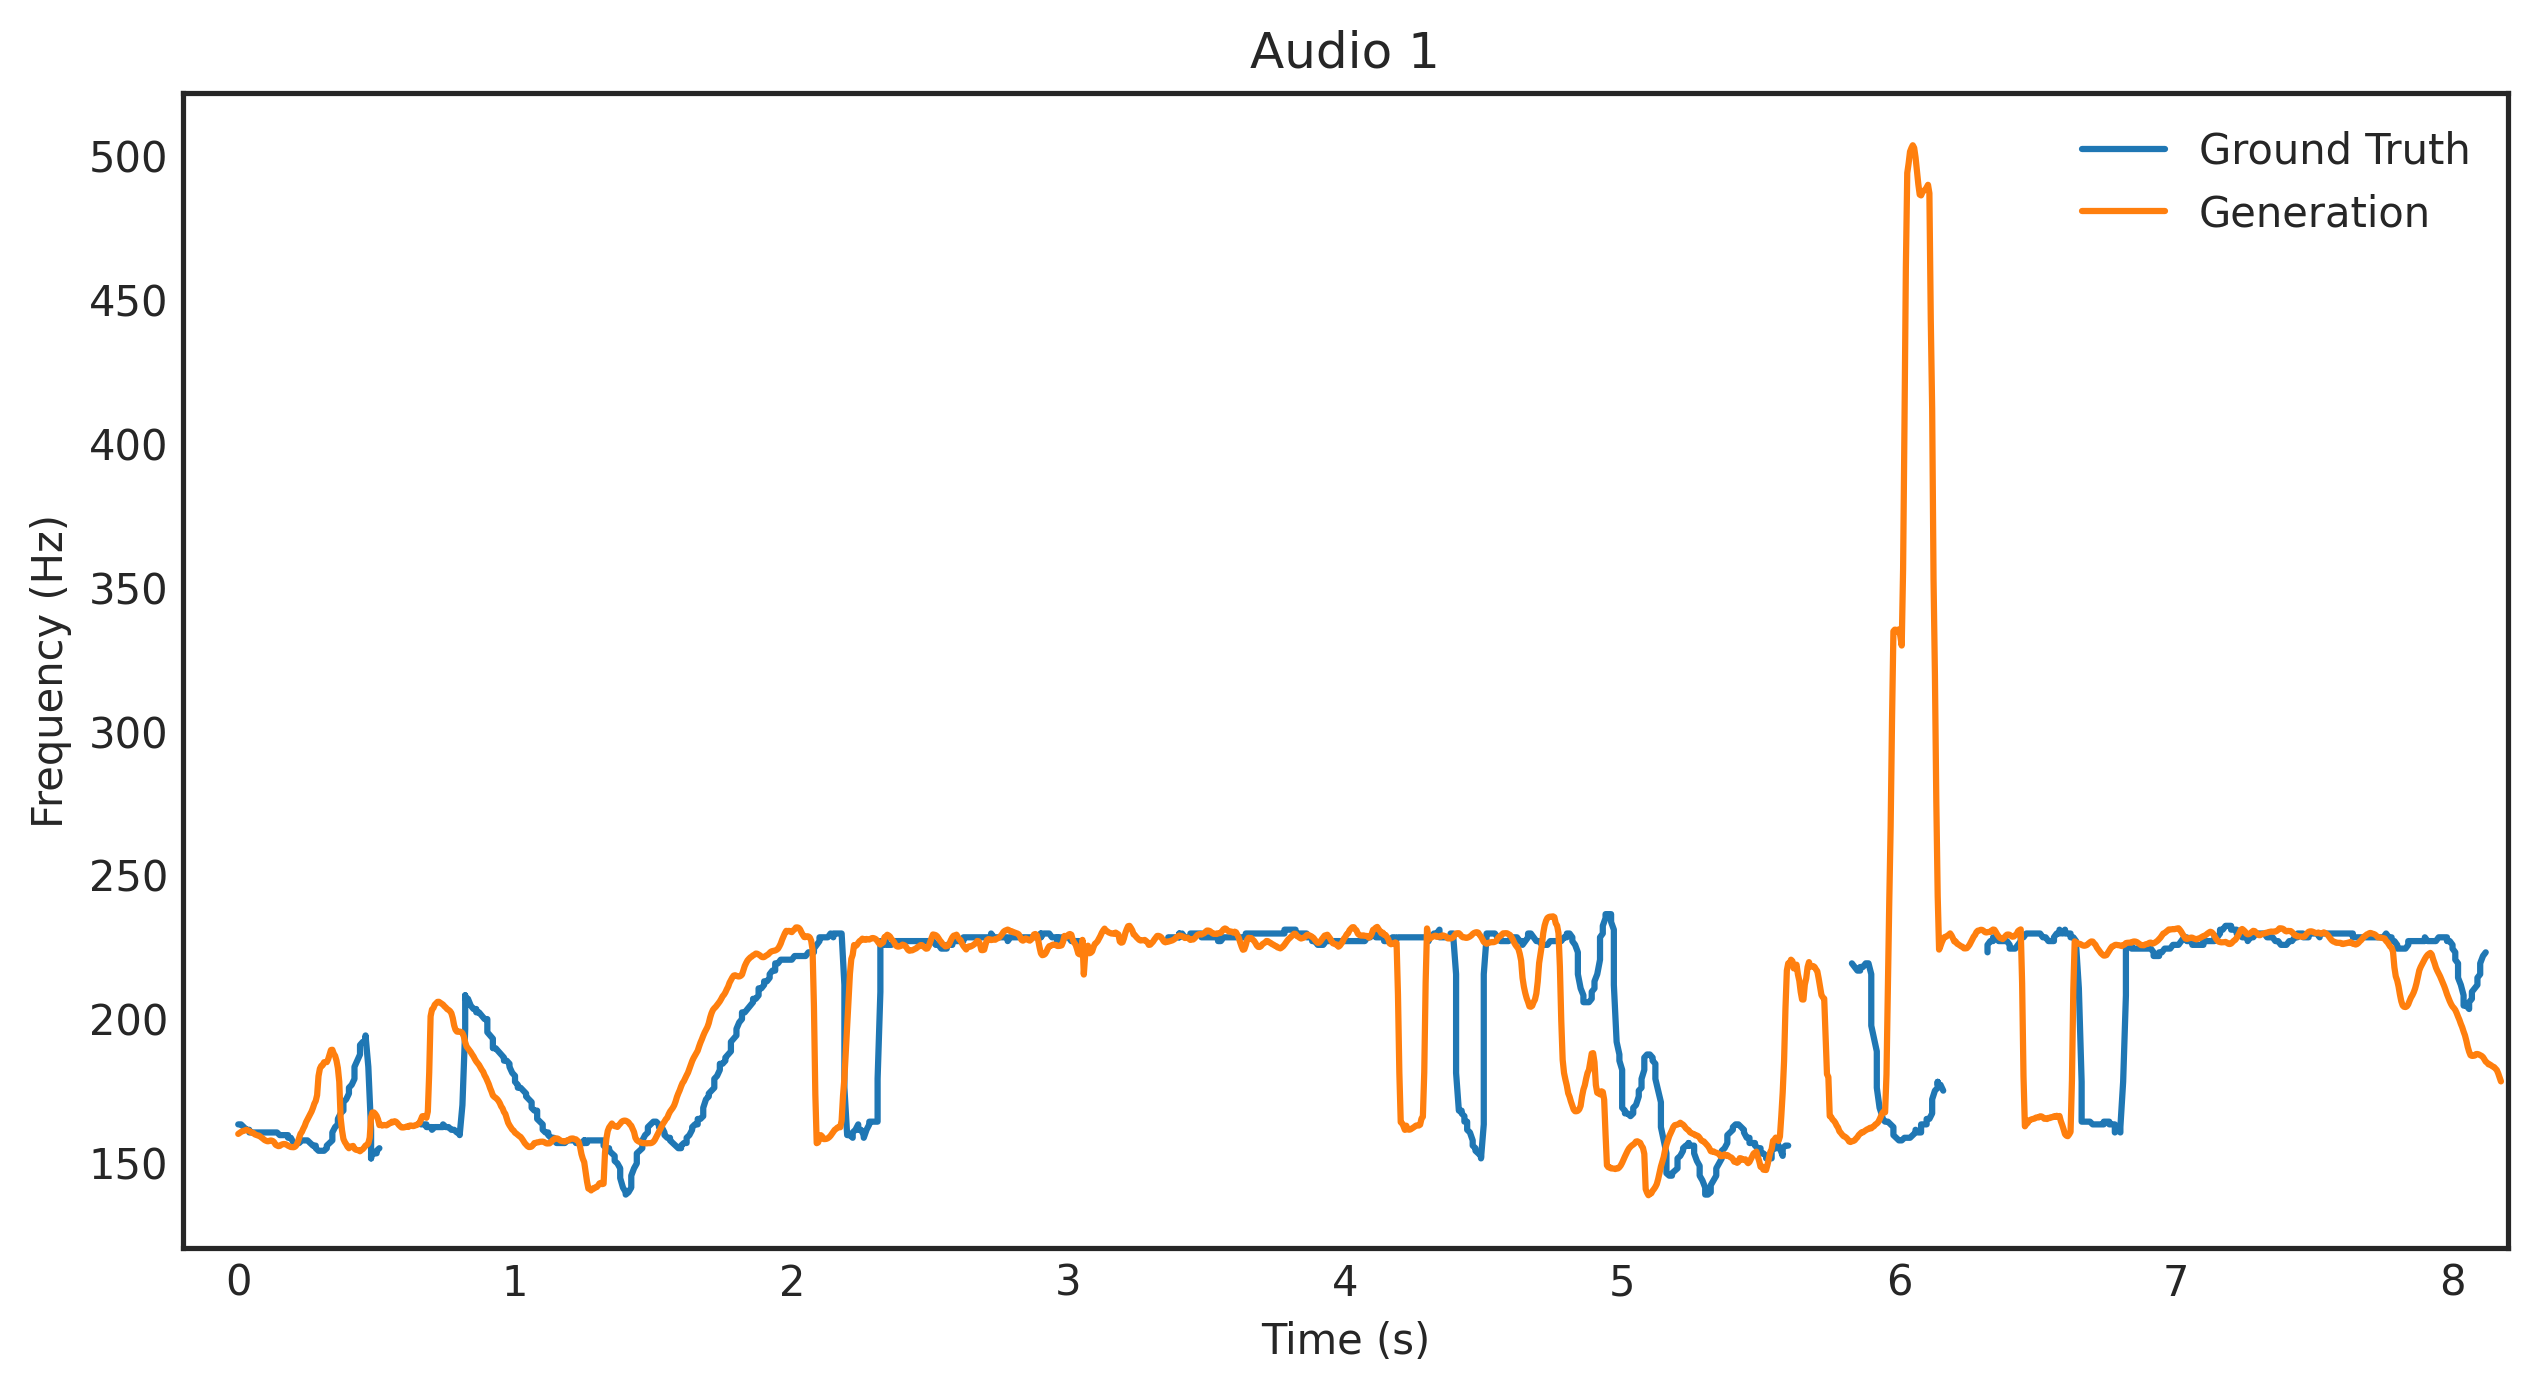
Plot of ground truth pitch contour condition and pitch extracted from audio generated by the spectrogram generator.
Example 3: Correlation (0.88)
Ground Truth Audio
Generated Audio
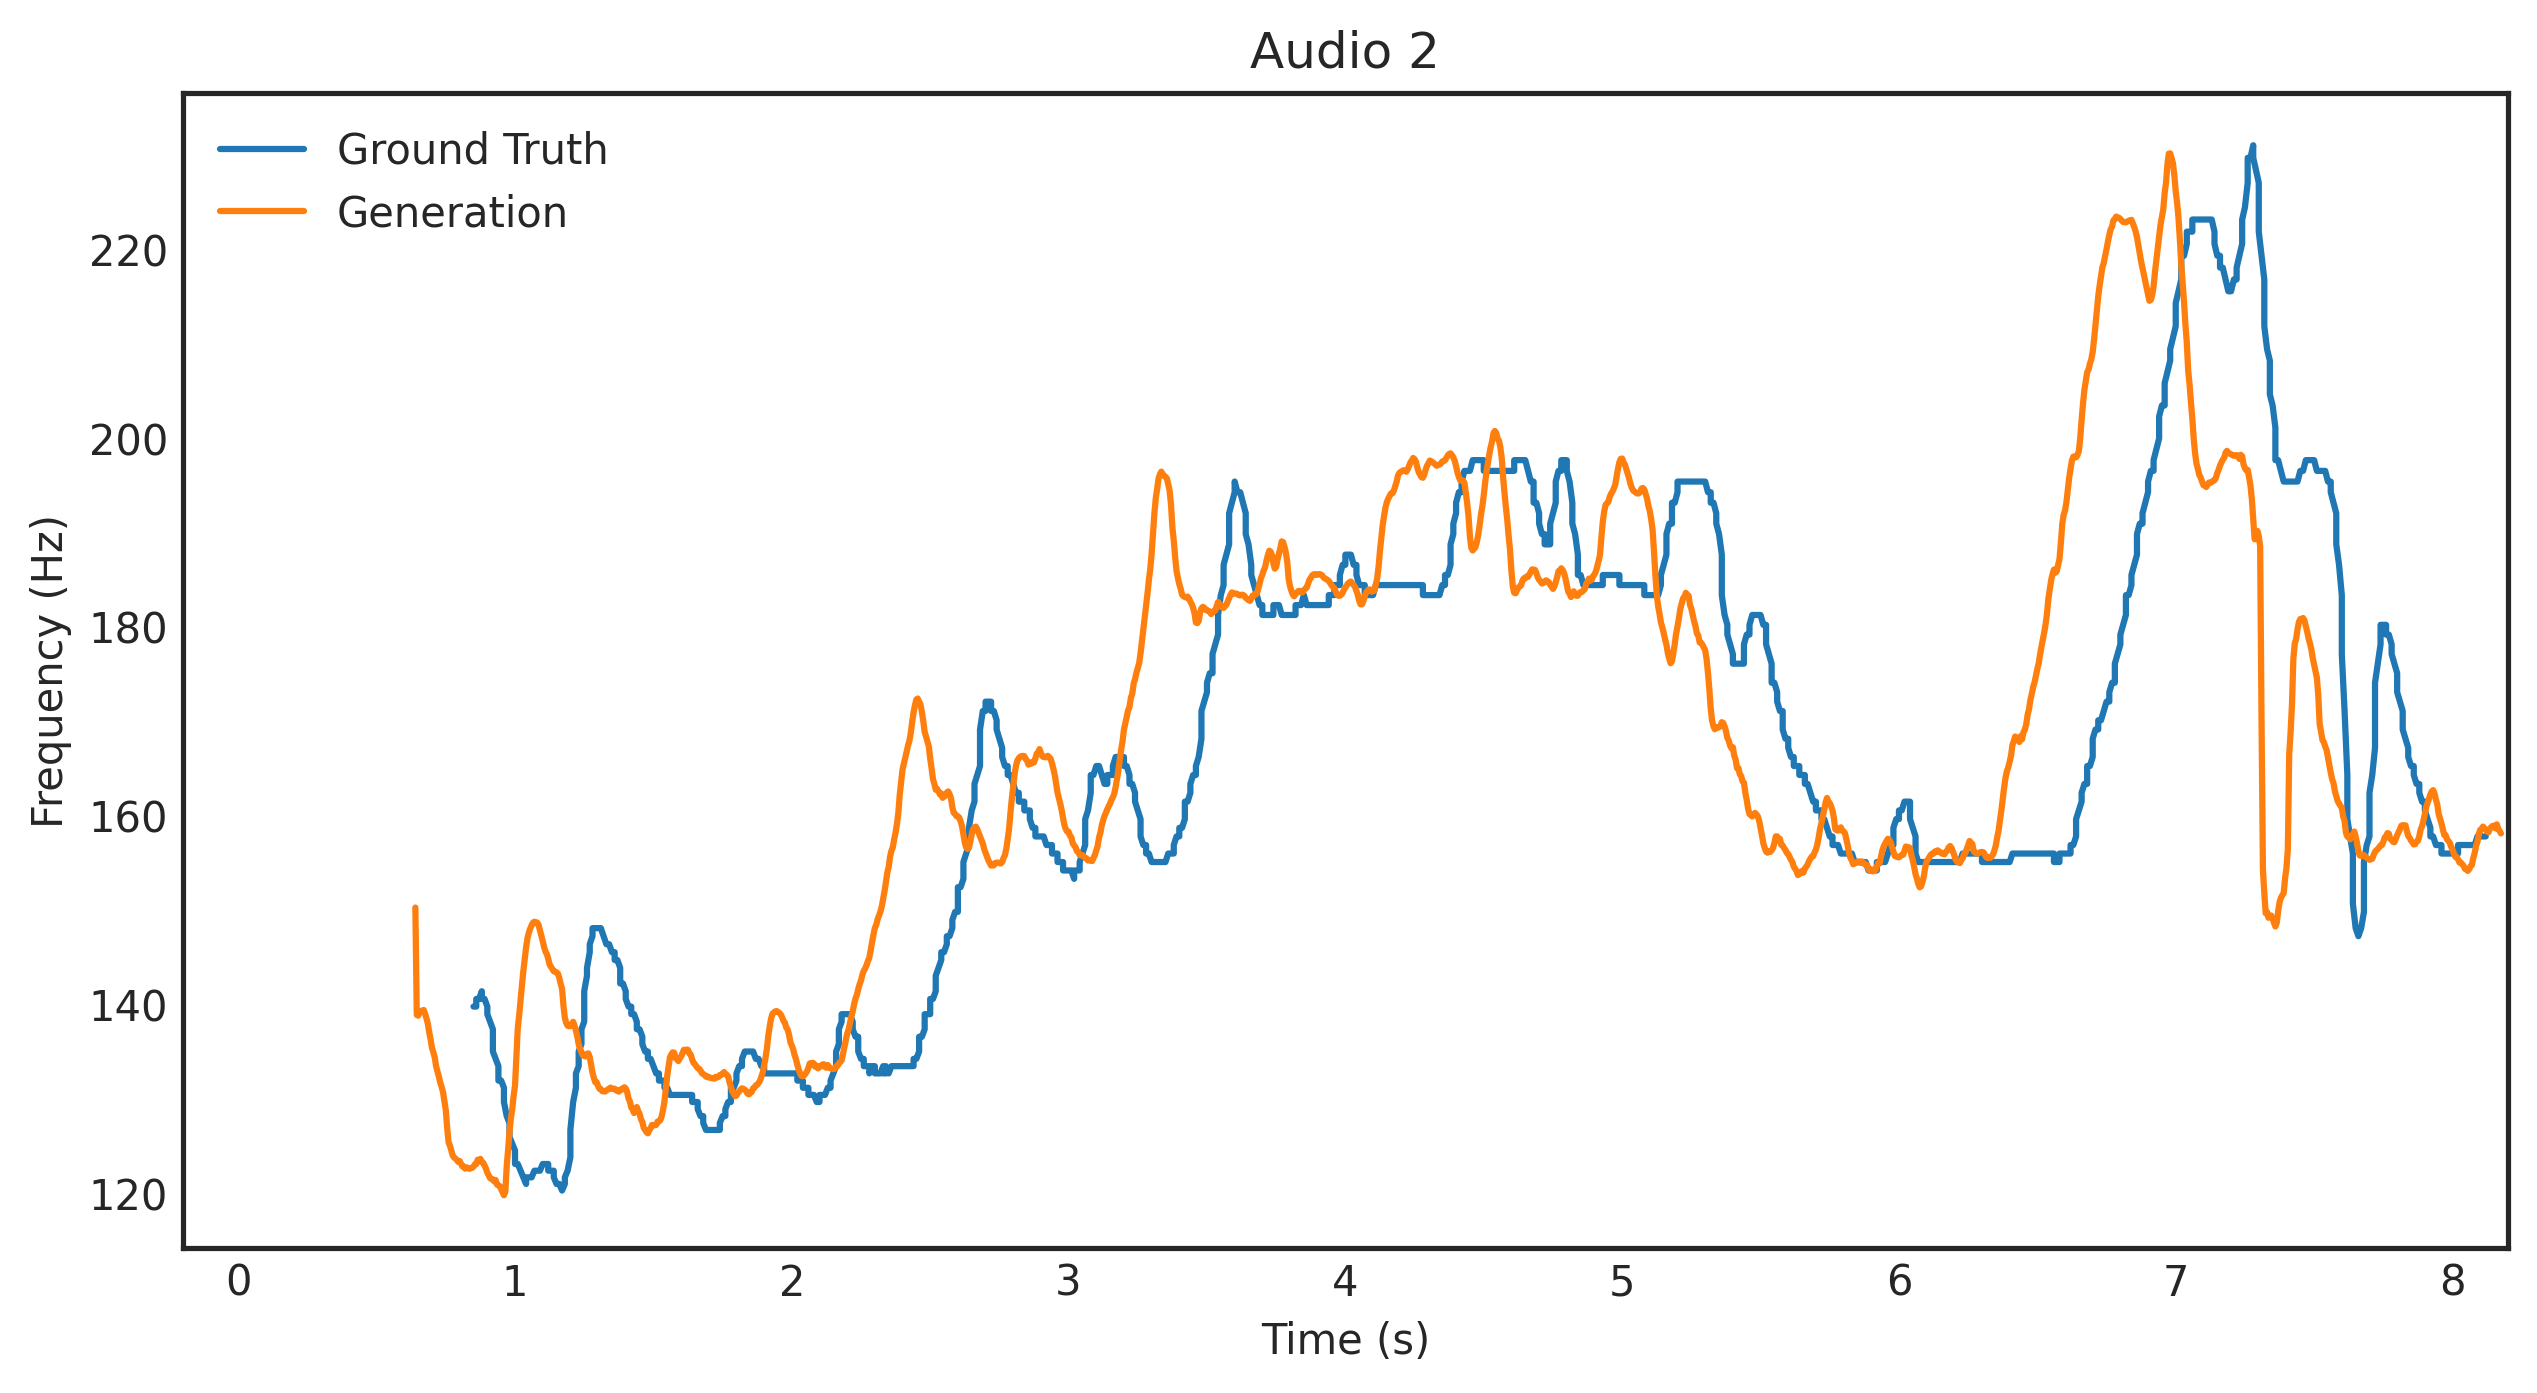
Plot of ground truth pitch contour condition and pitch extracted from audio generated by the spectrogram generator.
Example 4: Correlation (0.85)
Ground Truth Audio
Generated Audio
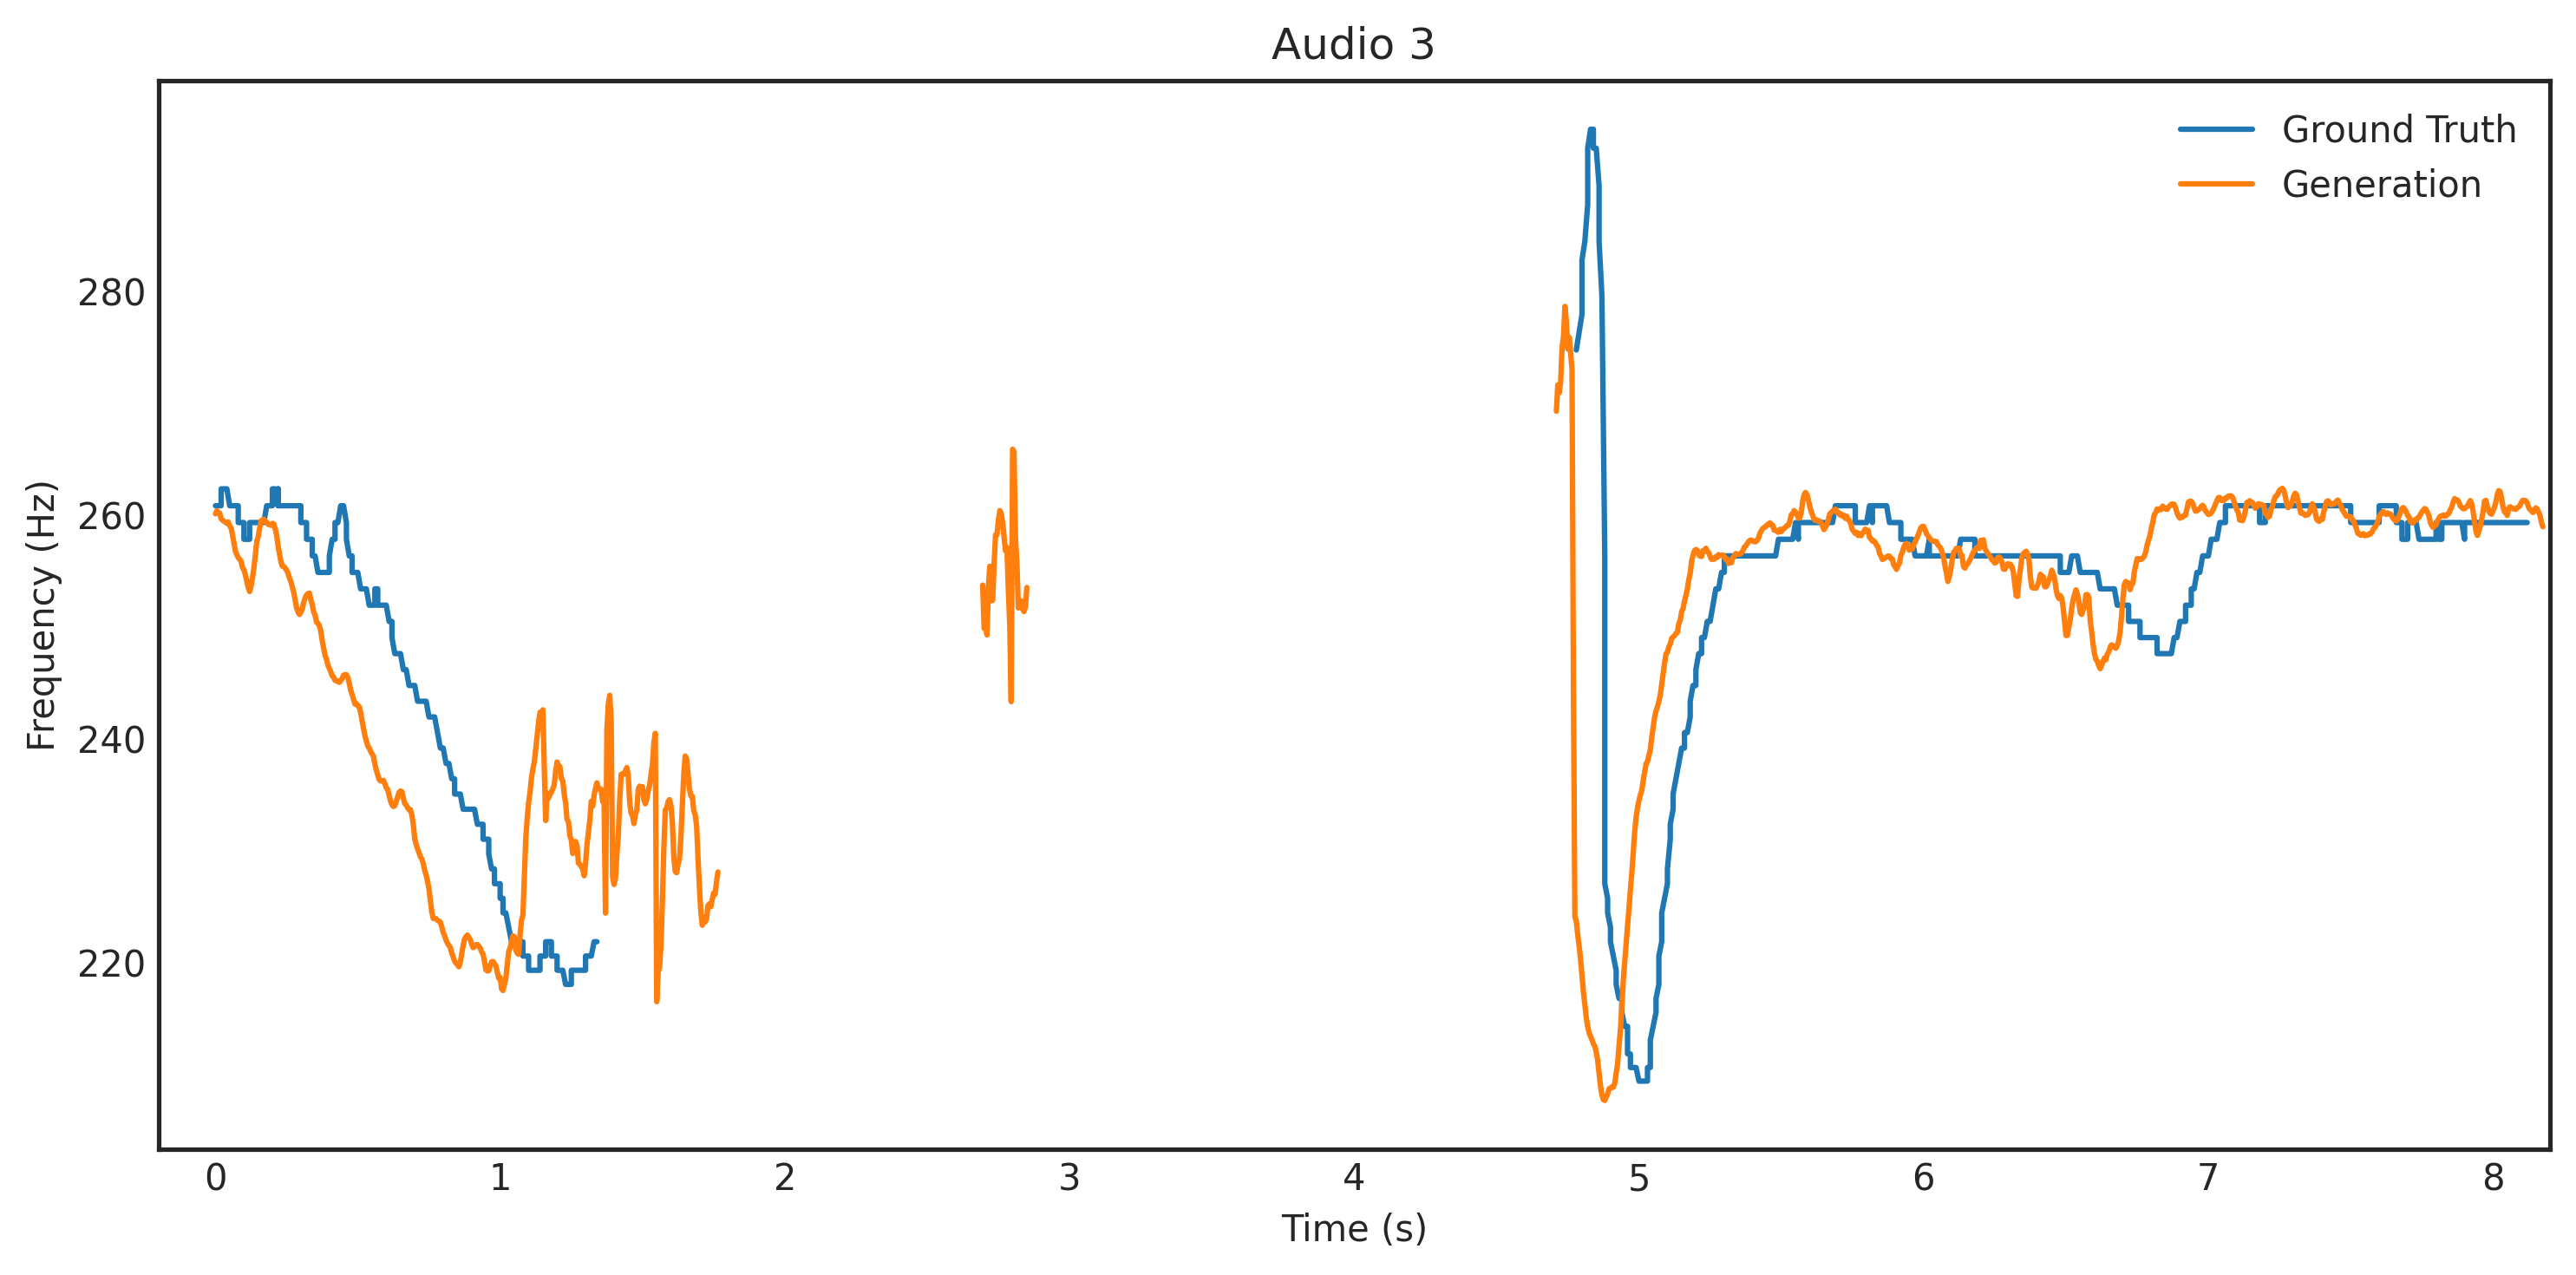
Plot of ground truth pitch contour condition and pitch extracted from audio generated by the spectrogram generator.